CPI Inflation, September 2021
Authors
CPI Inflation fell to 3.1% from the previous months 3.2%. Inflation was expected to fall as there was a “base effect” of -0.4% as the increase in inflation in August-September 2020 dropped out (this spike of 0.4% was partly due to the rebound from the Eat Out to Help Out and VAT cut in August 2020). However, in addition to this base effect, there was a significant element of new inflation, with prices rising by 0.3% between September and August. This followed from a very sharp rise of 0.7% in July-August.
There was a mixed experience across different sectors, with Transport and Food showing increases whilst Restaurants & Hotels and Clothing & Footwear showed a decrease.
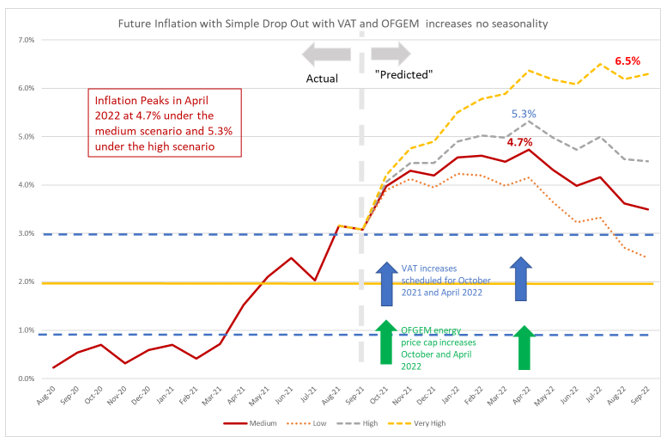
Looking forward, when we allow for the reversal of VAT reductions in the hospitality sector and scheduled and likely future rises in household energy prices announced by OFGEM, we expect inflation to increase rapidly in the later months of 2021and in early 2022. Inflation reaches a peak of 4.7-5.3% in the first quarter of 2022, falling to about 3.5% by September 2022. This peak is higher than we predicted last month because the September figure was slightly higher than expected, and we have built in a prediction for the likely increase in the OFGEM price cap in April 2022.
- The CPI inflation rate was 3.1% in September 2021, down from 3.2% in August. Part of this decrease was due to 0.4% of old m/m inflation dropping out (August-September 2020), often referred to as a “base effect”. There was additional new inflation between August and September 2021 of 0.3%, which is high but not unusually so.
- The NIESR trimmed mean CPI inflation, which captures core inflation and excludes the more extreme price changes, remained unchanged from its August figure of 1.6%.
- The new monthly inflation rate for August -September of 0.3% follows from four out of five months of high monthly inflation at 0.5-0.7%. The average monthly inflation over the five months March to September stands at 0.45%, which is well above average and would represent an annual inflation rate of almost 5.6% if sustained over twelve months.
- Next month will see an increase in headline inflation of 1% or more as the effects of the rise in the OFGEM price cap and increase in VAT on hospitality will be captured in October’s prices. The effect of the 7.5% increase in VAT on hospitality will depend on how much frims pass on to consumers, but could add on as much as 0.7% The OFGEM increase is more predictable at around 0.4%. Since the base effect for October is 0% (prices were level in September-October 2020), all of the increase in inflation in October 2021 will be because of the “new” inflation in September-October 2021.
- Looking at different types of expenditure, the main contributors to the change in inflation in August-September were:
- Restaurants & Hotels -0.3%
- Transport 0.07%
- Clothing and Footwear -0.06%
- Food & Non-Alcoholic Beverages 0.06%
The contribution of each type of expenditure is measured by the sum of the monthly inflation “dropping in” and “dropping out” for the type of expenditure multiplied by the weight of the expenditure type in the CPI index. The dropping in reflects the current month’s new inflation, and the dropping out the inflation from August-September 2020.
In Figure 1 we see for all twelve COICOP expenditure categories used in CPI the dropping in shaded light brown and the dropping out shaded light blue with the total given by the burgundy Line. In the case of both Restaurants & Hotels and Recreation & Culture, the dropping in and out reinforced each other, but the dropping out of the rebound from EOHO was clearly dominant. In Clothing & Footwear, the new and the old inflation worked in opposite directions, but overall there was a slight fall. Food & Non-alcoholic Beverages showed an increase overall despite the new inflation being negative. It was a similar story for Transport, with an overall increase driven by old inflation dropping out despite negative new inflation.
Whilst the overall contribution of 10 out of the 12 different types of expenditure was positive, in all cases except for Restaurants & Hotels the dropping in and dropping out operated opposite directions. The other exception was Education, which is constant in all months except for September, and stepped in to make its very modest annual contribution to inflation of 0.01%.

Extreme items
Out of over 700 types of goods and services sampled by the ONS, there is a great diversity in how their prices behave. Each month some go up, and some go down. Looking at the extremes, for this month, the Top ten items with the highest monthly inflation are:

The “Bottom Ten” items with the highest negative inflation this month are shown in Table 2.

In both these tables we look at how much the item price-index for this month has increased since the previous month, expressed as a percentage. These calculations were made by my PhD student at Cardiff University, Yang Li.
Looking ahead
We can look ahead over the next 12 months to see how inflation might evolve as the recent inflation “drops out” as we move forward month by month. Each month, the new inflation enters into the annual figure and the old inflation from the same month in the previous year “drops out”.[1]
We do this under four scenarios.
- The “medium” scenario assumes that the new inflation each month is equivalent to what would give us 2% per annum – 0.17% pcm -(which is both the Bank of England’s target and the long-run average for the last 25 years)
- The “high” scenario assumes that the new inflation each month is equivalent to 3% per annum (0.25% pcm)
- The “low” scenario equivalent to 1% per annum – (0.08% pcm).
- The “very high” scenario equivalent to 6% per annum – (0.4% pcm). This reflects the inflationary experience of the UK in 1988-1992 (when mean inflation was 0.45%) or recent US experience. It also reflects the continuation of the current UKaverage in the period March-September in the UK. This level of mom inflation would indicate a significant break from the historic behaviour of inflation from 1993-2020 and the failure of the Bank of England to control inflation.
We have added the “Very High” scenario to reflect the view that is becoming more widespread that inflation may be taking off from recent historic norms.
In addition, we also have additional “drop ins” resulting from government policy:
a) The reversal of the July 2020 reduction of VAT to only 5% for hospitality, hotel and holiday accommodation and admission to certain attractions. This reversal will happen in two equal increases of 7.5% at the end of September 2021 and March 2022 returning VAT to the standard rate of 20%. These two increases will show up in the October 2021 and April 2022 inflation figures. Using the relevant CPI weights, if all the increase is passed on, the impact on headline inflation could be over 0.5% both times. However, 100% “pass through” is unlikely, and I have opted for 0.3% impact in each of the two months.
b) OFGEM. The increase in the energy price-cap from the end of September will show up in the October 2021 inflation figures. Again, using the relevant CPI weights this gives a likely impact of 0.4%. There will be another increase to the price-cap in April 2022. Whilst OFGEM will announce this nearer the time, given the behaviour of energy prices in recent months the increase is likely to be of a similar size to the most recent one. Hence, we have added in an additional drop in of 0.4% for April 2022.
The patterns of the medium and high projections are similar, with a big increase in October and November 2021, a fall December 2021, and an increase in April 2022. After the April peak, inflation heads down and drops to 3.5% in the medium scenario by September 2022. This means that the inflation will remain well above the Bank of England’s target of 2% for some time to come (18-24 months) even if the underlying inflation remains at its historic average as in the medium scenario. In other words, Inflation will remain above 3% for at least 12 months.
However, we have added the very high inflation scenario to reflect an inflationary experience closer to the UK recent average, the 1988-1992 period and current inflation in the US. In this scenario, inflation heads up to over 6% by April 2022 and remains there until August 2022. If the supply chain and energy issues persist or get worse, this is the sort of inflationary trajectory we might see. If this trajectory materialiseded, it would imply a complete failure of the Bank of England’s inflation targeting policy and inflationary expectations would almost certainly move away from their historic 2% anchor. However, even under the medium and high scenarios, the behaviour of inflation will pose a challenge for the Bank’s credibility.
Figure 2: Looking forward to August 2022.

Commentary
September saw a slight drop in inflation from 3.1% to 3.2%. However, this is the calm before the storm and we will see a rapid increase in inflation over the coming 6-7 months to levels not seen for a decade, possibly exceeding 5%. The drop was expected, as there was a strong base effect contributing a fall of 0.4% to headline inflation. The relief is that the new inflation of 0.3%, although large, was not exceptional and still left us with an overall drop.
If we look back over 2021, there were four months of high monthly inflation between 0.5-0.7% (March-April, April-May, May-June and July-August), with a brief respite when we saw it drop to zero in June-July. The new August-September figure of 0.3% is in the 60th percentile, so that whilst above average it is by no means unusual as mom inflation is quite a noisy series. Furthermore, there is a slight positive seasonal effect for September (roughly 0.05%).
The prospects for inflation are now worse than they seemed 6 months ago or even 3 months ago. Of course, even back in April or July, the prospects were very uncertain. This was because of uncertainty about how the imbalance between the supply side and demand side effects of the pandemic and post-pandemic recovery would play out. Very broadly, the government seems to have dealt with the demand side well, and it is the supply side that has come to dominate in the later months of 2021. However, a number of factors have meant that the increase in inflation in the closing months of 2021 will be bigger and the period of elevated inflation will last for longer.
- During the pandemic, there was a shift in expenditure from services to goods. This was in part forced upon consumers during the pandemic and lockdowns, but even as social distancing rules are being relaxed there appears to have been a longer-run shift in expenditure preferences. This has put great pressures on the more industrialised countries to meet this higher demand and within countries their manufacturing sectors. It remains to be seen how persistent this shift in preferences is and whether expenditure patterns will eventually revert to their pre-pandemic pattern or more likely move to some degree of permanent shift to a new post pandemic normal.
- The labour market has been slow to adjust to the rapid changes. Labour shortages have appeared across the globe and are very acute in the UK. Again, this is in part a change in preferences. Workers may have decided to adjust their work-life balance, be more reluctant to commute, be unwilling to change job. There is also the shift in employment demand resulting from the shift in expenditure patterns. In normal times there are usually lags and “adjustment costs” that go along with this sort of change in the labour market. Post pandemic, these standard processes of adjustment have become larger and faster, with the labour market and firms having difficulty to cope with these big adjustments. In the UK, the furlough scheme kept people out of the labour market and whilst it may have protected jobs, it has also slowed up labour market adjustment in its later phase.
- Wages and salaries. These have proven hard to track during the pandemic due to composition effects (the average rose because lower paid jobs were most affected during the pandemic). The existence of labour shortages persisting may well reflect a mis-match between skills needed and current skills and worker preferences , which may lead to a general increase in wages reinforced by the rising inflation. If this happens, then we will have the positive feedback between wage and price inflation which could lead to an increase in the underlying or “trend” inflation from its historic anchor of 2%.
- The rapid increase in energy prices which are now in the headlines. There is a world imbalance and general excess demand for energy. There are various reasons for this, from the bad winter last year to the lack of wind in Europe. In the UK, electricity and Gas prices are both well above any previous historical values, even their peak in 2008. Oil has also gone up, but is still below its historic highs of 2011-13. The Ofgem price cap is changed every six months, on October 1st and April 1st, entering the ONS inflation figures for those months. The big increases in 2021 at these dates seem likely to be repeated at least for April 1st 2022.
- Supply chain shortages have lasted longer than previously thought. Rather than a temporary re-adjustment as the pandemic ended, they have if anything continued to intensify and show little sign of abating in the near future. From seagoing container shipping to lorries, the transportation issues have become worse over time and resulted in delays and increased costs in moving goods around the world and within the UK. Of course, everything in the national and global economy is linked by the web of the Leontief inverse and shortages in one sector or service can affect lots of other sectors either directly or indirectly. How and when these supply chain issues will eventually start to ease is still a matter of considerable uncertainty and things are currently still getting worse rather than better.
The fact that inflation will probably remain well above the Bank of England’s target for the next 18-24 months might raise serious questions about continuing the Banks policy since 2009 of leaving interest rates fixed at near zero levels. Expectations of underlying inflation may start to rise, which would cause serious challenges for monetary policy going forward.
For further analysis of current and future prospects for inflation in the UK see:
Will Inflation take off in the UK? The Economics Observatory.
UK Economic Outlook Summer 2021: Emerging from the Shadow of Covid-19.
[1] This analysis makes the approximation that the annual inflation rate equals the sum of the twelve month-on-month inflation rates. This approximation ignores “compounding” and is only valid when the inflation rates are low. At current levels of inflation, the approximation works well, being accurate to within one decimal place of percentage annual inflation.
Related Blog Posts


Related Projects


Related News


Why it’s not worth worrying that the UK has technically entered a recession
26 Feb 2024
4 min read

1.2 million UK Households Insolvent This Year as a Direct Result of Higher Mortgage Repayments
22 Jun 2023
2 min read
Related Publications

Recessionary Pressures Receding in the Rearview Mirror as UK Economy Gains Momentum
12 Apr 2024
GDP Trackers
Related events

Summer 2023 Economic Forum

Spring 2023 Economic Forum

Winter 2023 Economic Forum

Autumn 2022 Economic Forum

Summer 2022 Economic Forum

Spring 2022 Economic Forum

Winter 2022 Economic Forum
