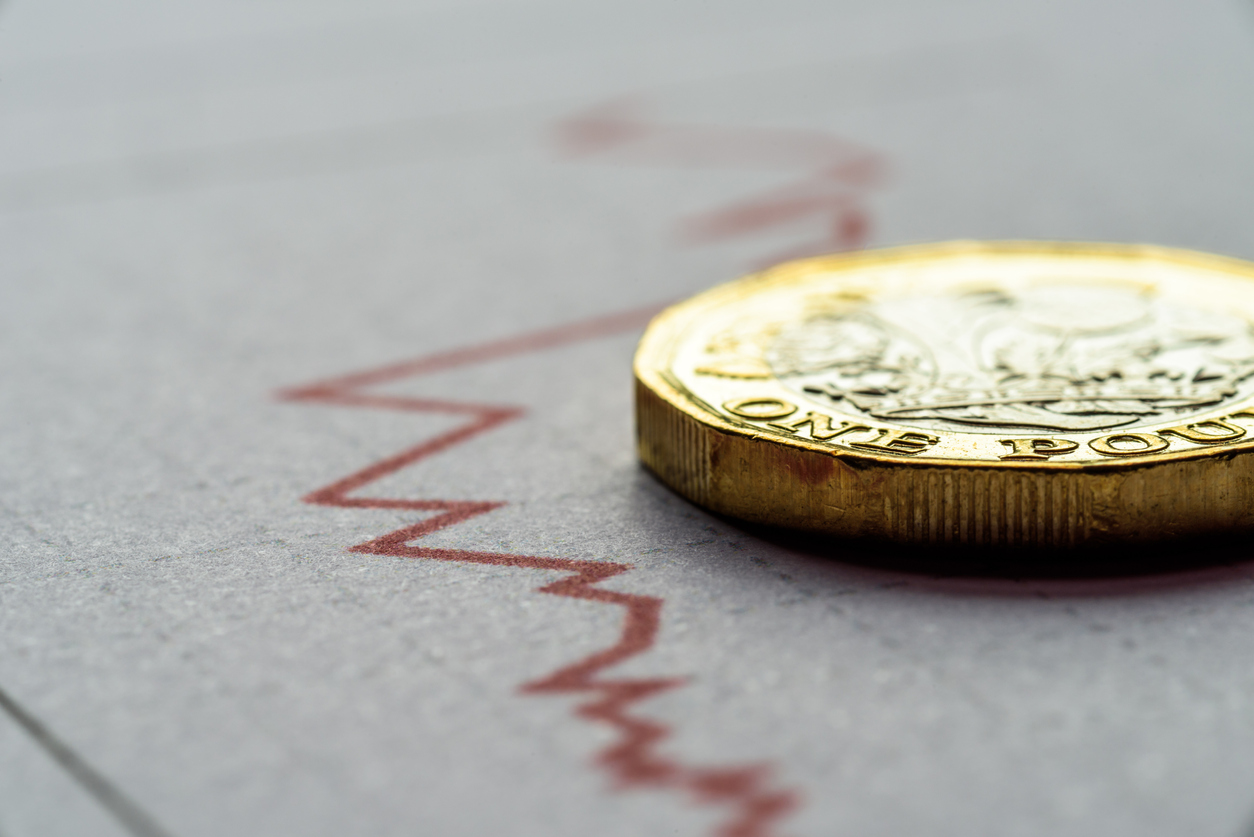
CPI Inflation, May 2021
CPI inflation rose by a large amount (0.6%) for the second month running and is now at 2.1%. The main drivers of the increase from April were Clothing and footwear and Recreation and Culture. Women’s clothing showed some very large increases. The current high levels of monthly inflation are unlikely to be sustained and are due to recovery of some prices from low levels in the first lockdown and short-run adjustment and supply-chain issues. Inflation will continue to increase until it peaks in early 2022 and then comes down again. The peak may be above 3% but is unlikely to exceed 4%. The high level of inflation in the US is driven by very different factors to UK inflation and we do not expect UK inflation to “catch up” with the high levels of US inflation
Authors
CPI inflation rose by a large amount (0.6%) for the second month running and is now at 2.1%. The main drivers of the increase from April were Clothing and footwear and Recreation and Culture. Women’s clothing showed some very large increases. The current high levels of monthly inflation are unlikely to be sustained and are due to recovery of some prices from low levels in the first lockdown and short-run adjustment and supply-chain issues. Inflation will continue to increase until it peaks in early 2022 and then comes down again. The peak may be above 3% but is unlikely to exceed 4%. The high level of inflation in the US is driven by very different factors to UK inflation and we do not expect UK inflation to “catch up” with the high levels of US inflation.
- The CPI inflation rate was 2.1% in May 2021, up from 1.5% in April. All of this increase of 0.6% was caused by new monthly inflation in April-May: the old inflation dropping out (April-May 2020) having been 0%. The new monthly inflation rate for April-May was 0.59%, 0.5% less than 0.64% in the previous month (although when rounded to one decimal place, both are recorded as 0.6%).
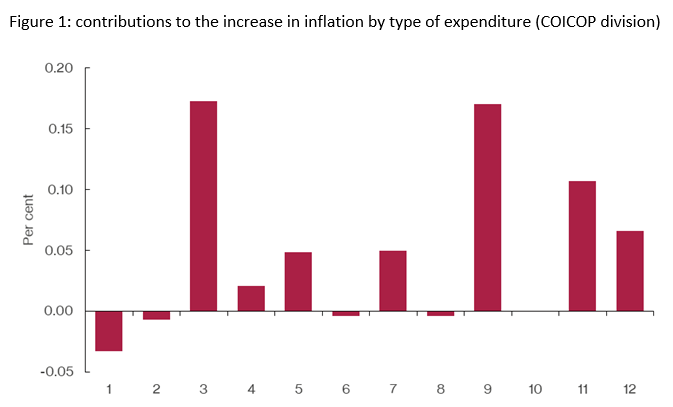
- Looking at different types of expenditure, the main contributors to the new inflation were:
- Clothing and Footwear, which contributed 0.17%
- Recreation and Culture, which contributed 0.17%
- Restaurants and Hotels, which contributed 0.1%
Clothing and footwear are volatile and its current value is not an unusual figure for monthly inflation. Recreation and Culture was a bit of a “bounce back” from the previous month when it was negative and of a similar but smaller magnitude.
The contribution is measured by the monthly inflation for the type of expenditure multiplied by the weight of the expenditure type in the CPI index (we focus on the current month and do not look at the effect of old inflation dropping out since the net effect is zero for this months inflation).

Extreme Items
Out of over 700 types of goods and services sampled by the ONS, and there is a great diversity in how their prices behave. Each month some go up and some go down. Looking at the extremes, for this month the Top ten items with the highest monthly inflation are:
| Table 1: top ten items for month-on-month inflation, May 2021 | |
| COMPUTER GAME DOWNLOADS | 31.2% |
| BOOK – FICTION – HARD COVER | 17.6% |
| ROADSIDE RECOVERY SERVICE | 15.4% |
| COMPUTER GAME 2 | 14.7% |
| WOMEN’S LONG SLV TOP-NT BLOUSE | 14.3% |
| WOMEN’S SKIRT: CASUAL | 13.8% |
| BOOK-NON-FICTION-PAPER-BACK | 13.7% |
| WOMENS DRESS -CASUAL/FORMAL | 13.7% |
| PRE-RECORDED DVD (FILM) | 13.3% |
| WOMEN’S CASUAL OUTER JACKET | 13.2% |
The “Bottom Ten” with the highest negative inflation in May 2021 are shown in Table 2.
| Table 2: Bottom ten items for mom inflation, my 2021 | |
| SEA FARES | -8.1% |
| MAYONNAISE 420-540MLS | -8.5% |
| SWEETS, NOT CHOC, 150-250G BAG | -9.0% |
| ANTIHISTAMINE ALLERGY TABLETS | -10.0% |
| COACH FARES | -10.4% |
| FLAVOURED WATER BOTT 900ML-1.5 | -11.4% |
| MOBILE PHONE APPLICATIONS | -13.2% |
| COOKED HAM LOOSE PER 100G | -15.0% |
| EBOOKS | -16.8% |
| EURO TUNNEL FARES | -39.1% |
In both these tables we look at how much the item price-index for May 2021 has increased since April 2021.
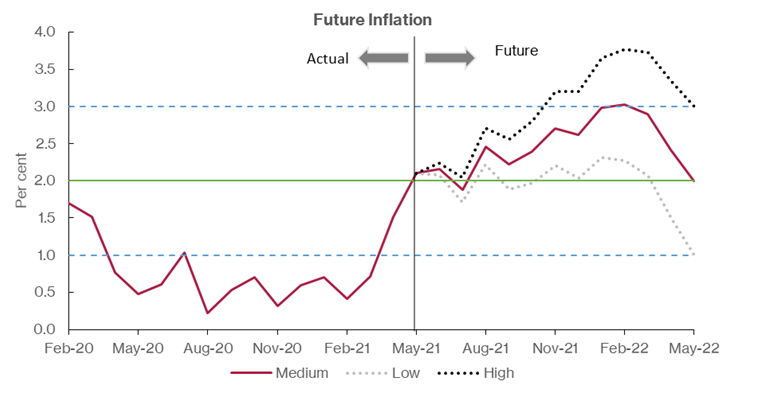
Looking Ahead
We can look ahead over the next 12 months to see how inflation might evolve as the recent inflation “drops out” as we move forward month by month.
Each month, the new inflation enters into the annual figure and the old inflation from the same month in the previous year “drops out”.[1]
We do this under three scenarios.
- The “medium” scenario assumes that the new inflation each month is equivalent to what would give us 2% per annum – 0.17% pcm -(which is both the Bank of England’s target and the long-run average for the last 25 years)
- The “high” scenario assumes that the new inflation each month is equivalent to 3% per annum (0.25% pcm)
- The “low” scenario equivalent to 1% per annum – (0.08% pcm).
The patterns of the projections are similar, with falls in July, September and December 2021 (the big increases of 2020 drop out) and big increases in August (as the big fall of August 2020 associated with Eat out to Help out drops out). There is a big fall in April and May 2022 as the big increases of these months in 2021 drop out.

Commentary
Monthly inflation has been unusually high for the past two months: 0.6% in April and May. If this were sustained for the next 10 months then by March 2022 inflation would be 7.4%. However, it is unlikely that this level of mom inflation will be sustained. The high level we see is driven by a range of factors, but the most important are:
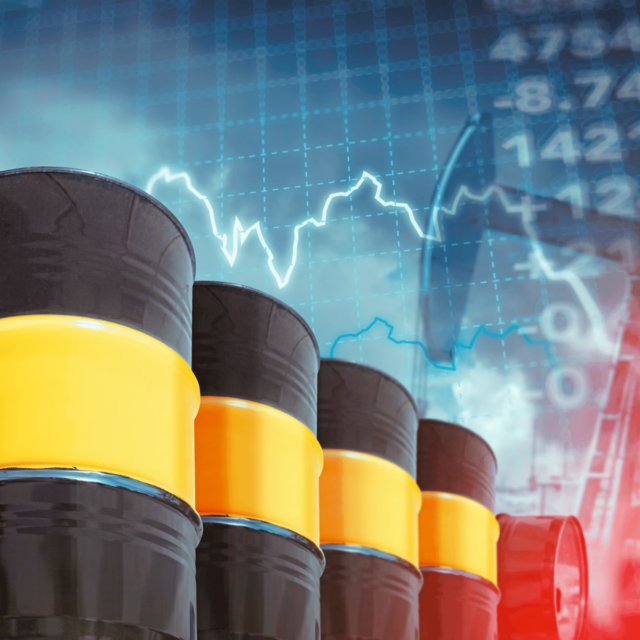
- The low inflation and price levels observed during the first lockdown. The Fuels and Lubricants index was 115 in January 2020, fell to 108 in May 2020 and is now at 117. The year on year increase is 7%, but the price is less than 2% above its January 2020 level. The “base level” effect will die away as we move forward.
- Adjustments and supply shortages. There have been many rapid changes and adjustments made during the pandemic, which can give rise to additional costs and disruptions to supply chains.
Both of these factors can be expected to be transitory. Commodity prices are rising fast, but again they are not high by historic standards. Also, more importantly, commodity prices represent only a small proportion of the value-added in final consumption for many consumer goods and services.
The huge increase in US inflation is clearly visible to see: annual inflation has risen to 5% in May 2021 from 4.1% in April. UK and US inflation often diverge, but we can see that there are some very different factors at work in the US. The impact of the Sino-American trade war is more acute in the US and covers a wide range of goods. There is no spike in the prices of second-hand cars in the UK and the car shortages over there have not been felt here (possibly because inventory levels are higher in Europe). Airline fares have also spiked in the US and are much more important for domestic travel and the cost of living than they are in the UK. Of course, inflation may spread, since some world prices are denominated in USD. Whether we will catch some of the US inflation via this mechanism remains to be seen. This will very much depend on what happens to the USD exchange rates with Sterling and other currencies.
For further analysis of the causes and future prospects for inflation in the UK, please see “Will Inflation take off in the UK?” The Economics Observatory.
[1] This analysis makes the approximation that the annual inflation rate equals the sum of the twelve month-on-month inflation rates. This approximation ignores “compounding” and is only valid when the inflation rates are low. At current levels of inflation, the approximation works well, being accurate to within one decimal place of percentage annual inflation.
Related Blog Posts


Related Projects


Related News
Call for Papers: Lessons From Quantitative Easing & Quantitative Tightening
09 Feb 2024
1 min read
Related Publications
Inflation Differentials Among European Monetary Union Countries: An Empirical Evaluation With Structural Breaks
20 Nov 2023
National Institute Economic Review
The Macroeconomic Effects of Re-applying the EU Fiscal Rules
20 Nov 2023
National Institute Economic Review
Another Look at a Sensible Fiscal Policy for the Sharp Rise in Government Debt
20 Nov 2023
National Institute Economic Review
Monetary Policy: Prices versus Quantities
20 Nov 2023
National Institute Economic Review
Related events
Assessing Cycles and Structural Changes in Markets
Business Conditions Forum