The Lockdown Weighted Inflation (CPILW) for January 2021
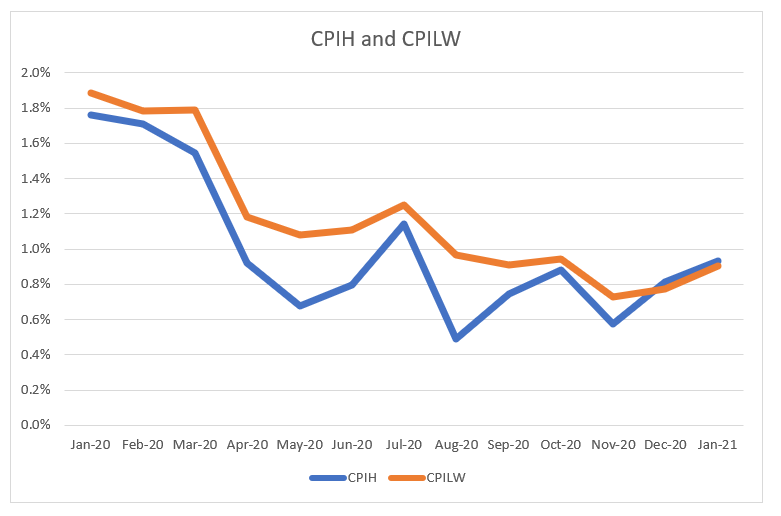
The CPILW rose slightly from 0.8% in December to 0.9% in January. The CPIH measure of inflation also increased from 0.8% in November 2020 to 0.9% in December. Both measures indicate a slight increase in inflation in January.
Authors
The CPILW rose slightly from 0.8% in December to 0.9% in January. The CPIH measure of inflation also increased from 0.8% in November 2020 to 0.9% in December. Both measures indicate a slight increase in inflation in January.
The gap between the official measure using pre-pandemic expenditure weights and the measure using lockdown weights has fallen from 0.04% in December to 0.02% in January. This is the second month for CPIH to exceed CPILW since the pandemic started.
January is the month when there is a “changing of the weights”. From January 2021 the CPIH is weighted using the estimated expenditure weights for 2020. This marks a shift from the usual practice of using the data from two years ago (which would have been 2019), reflecting the ONS’ desire to more accurately reflect the ongoing impact of the pandemic on expenditure. The effect of the change in weights this month is very small and if projected back into 2020 would result in a measure for current inflation almost identical to the CPIH and CPILW for January 2021.
The CPILW rose slightly from 0.8% in December to 0.9% in January. The CPIH measure of inflation also increased from 0.8% in December 2020 to 0.9% in January. Both measures indicate an increase in inflation in January. The gap between the two measures has narrowed in January to just 0.02%. This is the second month for CPIH to exceed CPILW since the pandemic started.
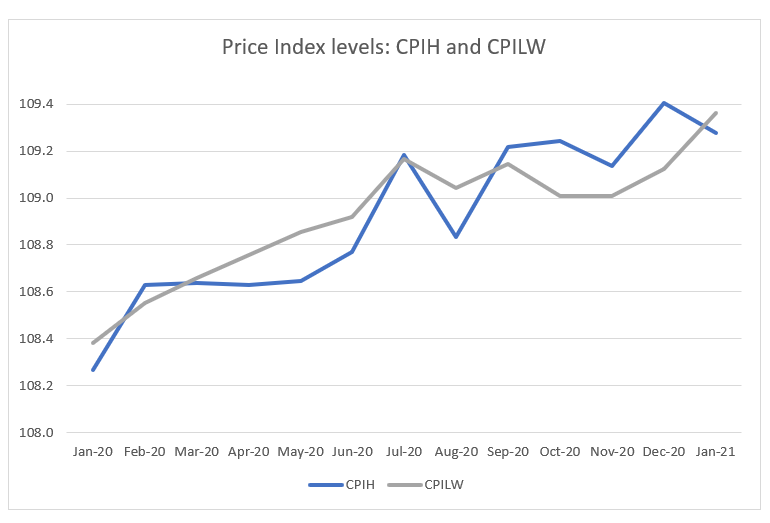
If we look at the change in headline CPIH inflation between December and January, we can see that there are substantial increases in three COICOP divisions: Food and Non-alcoholic beverages, Furniture and Household goods, Restaurants and Hotels (and to a lesser extent Transport). These were offset by a large decrease in Clothing and Footwear. The net effect was the slight increase observed in CPIH. If we instead look at the price level (The CPIH index), it actually fell in January as compared to December (a month on month decline of 0.12%).
Turning to CPILW, these changes are weighted differently – in particular, Restaurants and Hotels, Transport, and Clothing and Footwear have a smaller weight, whilst Food and Non-Alcoholic Beverages has a higher weight. Overall, the plusses and minuses cancel out, so that the headline 12-month inflation rate for CPILW moved in step with CPIH, showing a similar increase of 0.1%. However, there is a different story if we concentrate on the month-on-month changes. The lower weight on Clothing and Footwear again dominates, resulting in an increase in the overall CPILW index of the price level of 0.02% from December to January, rather than the decrease seen in CPIH.
The headline inflation measure is a backward-looking measure: the 12-month inflation figure is almost exactly the sum of 12 month-on-month figures (for low inflation environments where compounding can be ignored). Even if the two inflation measures give the same headline, their paths over the past months may well have been different (as is indeed the case for CPIH and CPILW).
If we look at the overall price-level as measured by the index, the price level for CPIH was the highest ever in December 2020, and after the fall in January still exceeds its value in all months prior to December. For CPILW the January price index is at an all-time high, exceeding its previous peaks of July and September 2020.
From April-December 2020, the CPIH inflation figures were constructed using the new methodology outlined ONS 2020 for dealing with the effects of the coronavirus. As discussed in Dixon NIESR Blog 8th May, this fails to adequately take into account the changes in expenditure shares during the Lockdown. Dixon (NIESR policy paper 16, April 22nd 2020) proposed a trial statistic CPILW to measure inflation using guesstimates of the Lockdown expenditure weights. In January, the ONS has changed the expenditure weights to the estimated expenditure shares for 2020 (from the national accounts data). The methodology and detailed reasoning can be found in ONS Feb 2021.
Changing expenditure shares can increase or decrease measured inflation, depending on how the different inflation rates for each type of expenditure behave. As time passes, we will see better measures to capture how expenditure is changing with the pandemic and this will help us to interpret the official inflation figures.
Further Reading
ONS “Corona Virus and the effect on UK Prices” May 5th 2020
Huw Dixon, “How can we measure consumer price inflation in a lockdown?” Economics Observatory, May 25th 2020
ONS “Re-weighted consumer prices basket – adjusting for consumption changes during lockdown: July 2020“, August 19th 2020
ONS “Coronavirus (COVID-19) and Consumer Price Inflation weights and prices: 2021“, 11th February 2021
Related Blog Posts


Related Projects


Related News
Call for Papers: Lessons From Quantitative Easing & Quantitative Tightening
09 Feb 2024
1 min read

Related Publications
Inflation Differentials Among European Monetary Union Countries: An Empirical Evaluation With Structural Breaks
20 Nov 2023
National Institute Economic Review
The Macroeconomic Effects of Re-applying the EU Fiscal Rules
20 Nov 2023
National Institute Economic Review
Another Look at a Sensible Fiscal Policy for the Sharp Rise in Government Debt
20 Nov 2023
National Institute Economic Review
Monetary Policy: Prices versus Quantities
20 Nov 2023
National Institute Economic Review
Related events
Assessing Cycles and Structural Changes in Markets
Business Conditions Forum