Ten years on: measuring the effects of the financial crisis on productivity
The 9th August 2007, the illiquidity of financial markets where derivatives linked to subprime mortgages were traded lead BNP Paribas to suspend three of its funds involved in those trades. This decision struck financial markets and lead to the public acknowledgement that a financial crisis was taking place.
Authors
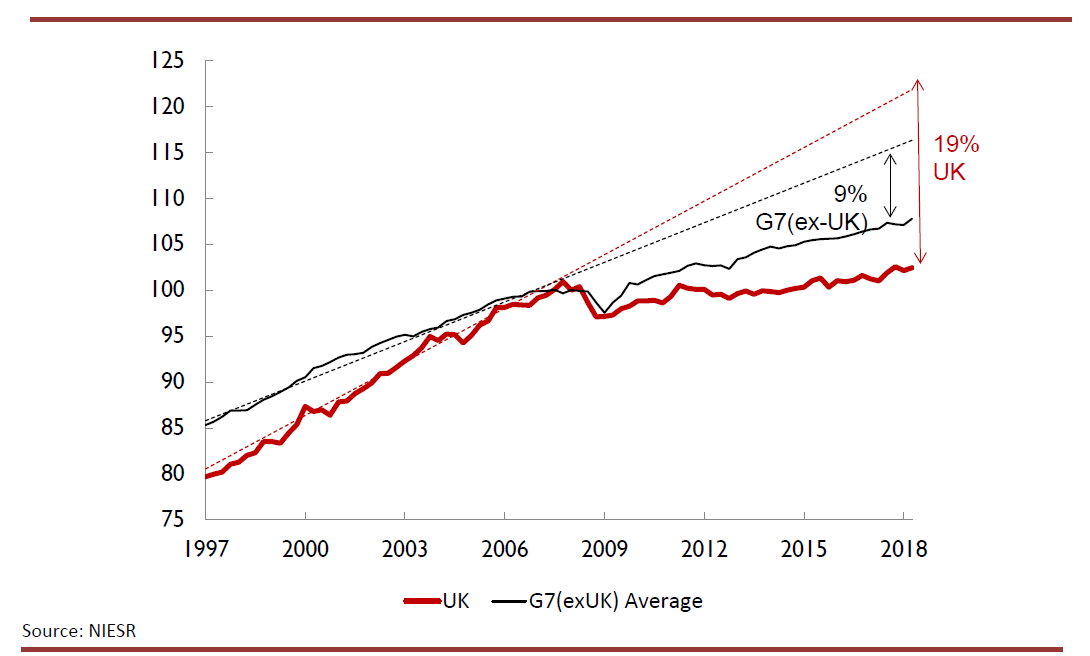
The 9th August 2007, the illiquidity of financial markets where derivatives linked to subprime mortgages were traded lead BNP Paribas to suspend three of its funds involved in those trades. This decision struck financial markets and lead to the public acknowledgement that a financial crisis was taking place. The crisis would lead to a global economic recession and set the scene for a debt crisis in Europe. Ten years on, the UK economy has to some degree recovered, but the recovery has been accompanied by a shift in the structure of its economy. While real output has managed to reach its pre-crisis peak and employment has been surprisingly resilient, other economic indicators such as real wages, business investment and labour productivity have performed relatively poorly. It would appear that in the recovery phase, the UK economy has become a more labour intensive – less efficient – economy. In our article we explore the role of overall and sectorial productivity in explaining the fall in labour productivity, but also question the extent to which productivity in the service sector may be measured with error.
The financial sector is sometimes seen as a major cause for the stagnant productivity that followed the financial crisis. One possibility is that it may have contributed or amplified economic performance prior to the financial crisis and have subsequently performed less well and acted to exaggerate the downturn. To investigate the issue we can analyse sectorial contribution of productivity to gross value added (GVA). GVA is defined as the total value of output of goods and services produced less intermediate consumption, and to measure it in real terms output and intermediate consumption are deflated using price indices such as the Consumer Price Indices (CPI), Services Producer Prices Indices (SPPI) or the GDP deflator. Overall contribution of productivity to GVA has fallen from 1.4 per cent on average in the decade prior to the crisis to –0.9 per cent on average since; with the financial sector having the largest swing by moving from 2.4 per cent to –2.8 per cent. One hypothesis to examine is whether sectors, such as financial services, that performed strongest prior to 2007/8, then performed weakest subsequently. But what we find is that each individual sector has a lower contribution to GVA on average, which implies a common rather than sector specific shock.
It is important, however, to bear in mind that gross value added – which is an essential component when measuring productivity – is subject to measurement issues, notably for services and the public sector. While output for the manufacturing sector is relatively easily measurable both in value and real terms, government services and services in general are much more difficult to measure. The difficulty in measuring the service sector is that it encompasses a multitude of activities which all require specific measures of their output. Notably, the financial sector is one of the most challenging sectors to measure and can be divided into three categories: the banking sector, non-bank financial intermediaries and insurance and pension funds. Banking output consists of fees and commissions receivable, Net Spread Earnings (NSE), other operating income and Financial Intermediation Services Indirectly Measured (FISIM), which is the margin between earnings made on loans minus interests paid on deposits. The latter should be differentiated between FISIM contributing to real demand, such as consumption credits, and FISIM contributing to intermediate consumption, such as mortgages and business loans. A large share of banking activity is therefore considered as intermediate consumption for other businesses. Non-bank financial intermediaries also provide FISIM in addition to asset management. An overestimate of financial intermediaries’ FISIM contributing to intermediate consumption will hence lead to higher measured financial sector productivity while reducing other sectors’ productivity. Another issue arises when real GVA indicators are constructed. As previously explained, price indices are used to deflate nominal indicators, however currently the same price index is usually used to deflate both output and intermediate consumption and this can lead to misleading results. The problem is more profound for the financial sector because we have not yet constructed an adequate price indicator for its output.
Measurement challenges constrain the analysis when identifying the role of the financial sector productivity in explaining the overall fall in productivity growth. For economic analysis to lead to adequate and timely policy measures, we need to better understand the mechanisms leading to sectorial economic fluctuations and their effect on the aggregate activity. This requires more precise and detailed measure, notably at the sectoral level, of the economic indicators such as gross value added and productivity. Current research programs undertaken by ESCoE in collaboration with ONS are dedicated to breaching this gap and improve the measurement of the service sector and in particular the financial sector.
Related Blog Posts


Related Projects


Related News


Related Publications


Productivity and Investment: Time to Manage the Project of Renewal
12 Mar 2024
UK Productivity Commission
UK Households Should Start Feeling Better Off as Election Looms
07 Feb 2024
UK Economic Outlook

Low to Middle Income Households Facing Seven Years of Falling Living Standards
08 Nov 2023
UK Economic Outlook
Related events

Investing for Growth: boosting productivity through higher public and private investment

The Outlook for the Welsh Economy

Prais Lecture with Chris Pissarides: The Future of Work and Wellbeing

A View and Prospects for British Investment

How Can We Raise Investment?

Productivity Commission Evidence Session: Examining the Role of International Investment

High Dimensional Forecasting and its Pitfalls – M. Hashem Pesaran