CPI Inflation, June 2021
CPI inflation rose by a large amount (0.5%) for the third month running and is now at 2.5%. The contributions to inflation were spread across most types of expenditure, with Transport being the largest. The current high levels of monthly inflation are unlikely to be sustained and are due to recovery of some prices in the first lockdown and short-run adjustment and supply-chain issues. Inflation will continue to increase until it peaks in early 2022 and then comes down again. The peak may be above 3% but is unlikely to exceed 4%. The high level of inflation in the US is driven by very different factors to UK inflation and we do not expect UK inflation to “catch up” with the high levels of US inflation.
Authors
CPI inflation rose by a large amount (0.5%) for the third month running and is now at 2.5%. The contributions to inflation were spread across most types of expenditure, with Transport being the largest. The current high levels of monthly inflation are unlikely to be sustained and are due to recovery of some prices in the first lockdown and short-run adjustment and supply-chain issues. Inflation will continue to increase until it peaks in early 2022 and then comes down again. The peak may be above 3% but is unlikely to exceed 4%. The high level of inflation in the US is driven by very different factors to UK inflation and we do not expect UK inflation to “catch up” with the high levels of US inflation.
- The CPI inflation rate was 2.5% in June 2021, up from 2.1% in May. Most of this increase of 0.4% was caused by new monthly inflation in May-June of 0.5%: the old inflation dropping out (May-June 2020) being just -0.1%.
- The new monthly inflation rate for May-June of 0.5% was high, but lower than in the previous two months (for April-May and March-April it was 0.6%). If sustained for 12 months, 0.5% per-month would lead to over 6% annual inflation.
- Looking at different types of expenditure, the main contributors to the change in inflation in May-June were:
- Transport, which contributed 0.11%
- Food and Non-Alcoholic Beverages, which contributed 0.08%
- Clothing and Footwear, which contributed 0.06%
However, positive contributions to inflation were spread across all types of expenditure except for Health.
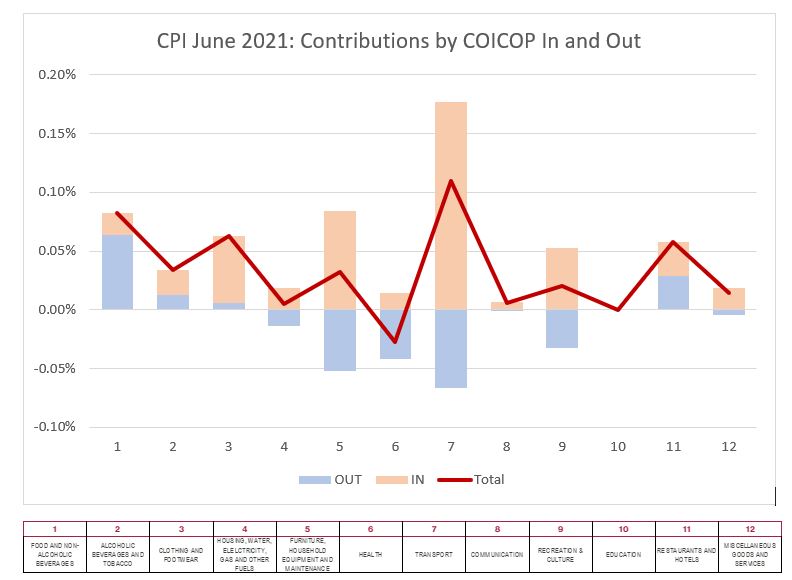
The contribution of each type of expenditure is measured by the sum of the monthly inflation “dropping in” and “dropping out” for the type of expenditure multiplied by the weight of the expenditure type in the CPI index. The dropping in reflects the current months new inflation, and the dropping out the inflation from May-June 2020. In Figure 1 we show for all twelve COICOP categories the “dropping in” in shaded light brown and the “dropping out” shaded light blue with the total given by the Mauve Line. Note that the large total effect of FANB (Division 1) is mainly driven by the blue segment dropping out.
Figure 1: Contributions to the increase in inflation by type of expenditure (COICOP division).
Extreme Items
Out of over 700 types of goods and services sampled by the ONS, and there is a great diversity in how their prices behave. Each month some go up and some go down. Looking at the extremes, for this month the Top ten items with the highest monthly inflation are:
| Table 1: top ten items for month-on-month inflation, June 2021 | |
| EURO TUNNEL FARES | 35.3% |
| EBOOKS | 24.1% |
| MOBILE PHONE APPLICATIONS | 21.4% |
| MENS OFFICIAL FOOTBALL SHIRT | 21.2% |
| FRUIT DRINK BOTTLE 4-8 PACK | 15.4% |
| BLU RAY DISC (FILM) FROM CHART | 12.2% |
| INTERNET DVDS | 11.5% |
| COOKED HAM LOOSE PER 100G | 10.8% |
| SEA FARES | 10.3% |
| INTERNET BLU-RAY DISC | 10.0% |
The “Bottom Ten” with the highest negative inflation in June 2021 are shown in Table 2.
| Table 2: Bottom ten items for mom inflation, June 2021 | |
| MOISTURISER FACIAL 50-150ML | -8.4% |
| ACTION CAMERA | -8.5% |
| BRANDY 70CL BOTTLE | -8.8% |
| COLA/FIZZY DRINK 330ML PK 4-8 | -9.0% |
| WOMENS SHORT SLEEVE SPORTS TOP | -9.1% |
| SHOWER GEL 150-250ML | -9.2% |
| ROADSIDE RECOVERY SERVICE | -9.8% |
| TOOTHPASTE (SPECIFY SIZE) | -10.3% |
| COMPUTER GAME DOWNLOADS | -12.1% |
| PREMIUM POTATO CRISPS/CHIPS | -13.9% |
In both these tables we look at how much the item price-index for June 2021 has increased since May 2021.[1]
Looking Ahead
We can look ahead over the next 12 months to see how inflation might evolve as the recent inflation “drops out” as we move forward month by month.
Each month, the new inflation enters into the annual figure and the old inflation from the same month in the previous year “drops out”.[2]
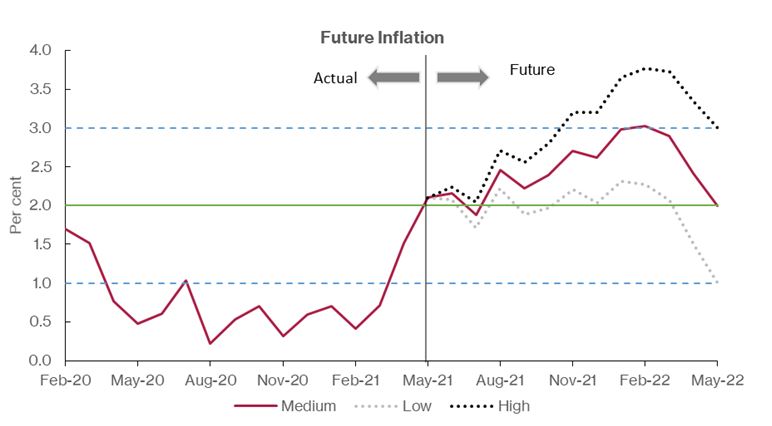
We do this under three scenarios.
- The “medium” scenario assumes that the new inflation each month is equivalent to what would give us 2% per annum – 0.17% pcm -(which is both the Bank of England’s target and the long-run average for the last 25 years)
- The “high” scenario assumes that the new inflation each month is equivalent to 3% per annum (0.25% pcm)
- The “low” scenario equivalent to 1% per annum – (0.08% pcm).
The patterns of the projections are similar, with falls in July, September and December 2021 (as the big increases of 2020 drop out) and big increases in August (as the big fall of August 2020 associated with Eat out to Help out drops out). There is a big fall in April to June 2022 as the big increases of these months in 2021 drop out.
Commentary
Monthly inflation has been unusually high for the past three months: 0.6% in April and May and now 0.5% in June. If this high level of monthly inflation were sustained for the next 10 months then by May 2022 inflation would be 6-7%. However, it is unlikely that this level of mom inflation will be sustained. The high levels of mom inflation in April-June 2021 will “drop out” in April-June 2022, a total negative impact on inflation of -1.7%. Thus the most likely months for a peak in inflation are February and March 2022.
The high level of mom inflation we see is driven by a range of factors, but the most important are:
- The low inflation and price levels observed during the first lockdown. The Fuels and Lubricants index was 115 in January 2020, fell to 108 in May 2020 and is now at 117. The year on year increase is 7%, but the price is less than 2% above its January 2020 level. The “base level” effect will die away as we move forward.
- Adjustments and supply shortages. There have been many rapid changes and adjustments made during the pandemic, which can give rise to additional costs and disruptions to supply chains. These will continue for some months but will eventually be resolved.
- Labour market adjustments. Patterns of employment are changing rapidly and these take time to happen (people need to move across industries, retrain etc.). Also, Furlough has kept people out of the labour market and delayed their adjustment to new market conditions. Finally, habits have changed and people may take time to adjust their working behaviour back to the “new normal”.
The first two of these factors can be expected to be purely transitory. Commodity prices are rising fast, but again they are not high by historic standards. Also, more importantly, commodity prices represent only a small proportion of the value-added in final consumption for many consumer goods and services. Labour market effects may also be transitory. However, the third factor may persist if and there may be a longer-term reduction in labour supply and participation rates if households preferences have changed and they decide to consume less and take more leisure (in effect, the labour supply may contract and the “natural rate” of output and employment fall).
The huge increase in US inflation is causing concern world-wide: annual CPI inflation has risen to 5.4% in June 2021, with monthly inflation at 0.9%. UK and US inflation often diverge, but we can see that there are some very different factors at work in the US. The impact of the Sino-American trade war is more acute in the US and covers a wide range of goods. The spike in the prices of second-hand cars in the US has not been seen over here. The rapid rise in food prices (0.8% mom) is also largely absent here. Of course, inflation may spread, since many world prices are denominated in USD. Whether we will catch some of the US inflation via this mechanism remains to be seen. This will very much depend on what happens to the USD exchange rates with Sterling and other currencies.
For further analysis of the causes and future prospects for inflation in the UK see:
Will Inflation take off in the UK? The Economics Observatory.
https://www.economicsobservatory.com/will-inflation-take-off-in-the-uk
[1] These calculations were made by Yang Li, who is a PhD student at Cardiff.
[2] This analysis makes the approximation that the annual inflation rate equals the sum of the twelve month-on-month inflation rates. This approximation ignores “compounding” and is only valid when the inflation rates are low. At current levels of inflation, the approximation works well, being accurate to within one decimal place of percentage annual inflation.
Related Blog Posts

Related Projects


Related News
Letter to the Financial Times: Is Perfidious Albion About to Make a Return?
14 Jun 2024
3 min read

Call for Papers: Lessons From Quantitative Easing & Quantitative Tightening
09 Feb 2024
1 min read
Related Publications

Everything You Wanted to Know About the US Budget Deficit and Debt But Were Afraid to Ask
09 May 2024
Global Economic Outlook Box Analysis
To What Extent Has the Recovery and Resilience Facility Supported the EU Recovery from Covid?
09 May 2024
Global Economic Outlook Topical Feature
Inflation Differentials Among European Monetary Union Countries: An Empirical Evaluation With Structural Breaks
20 Nov 2023
National Institute Economic Review
Related events
2024 UK General Election: The Economy and Living Standards
Assessing Cycles and Structural Changes in Markets
Business Conditions Forum