The housing market in the macroeconomy
In light of new announcements expected from the Prime Minister today, heavily trailed as an attempt to place housing at the heart of the policy agenda once again, it is well worth looking at the role that the UK’s housing market plays in the macroeconomy.
Authors
In light of new announcements expected from the Prime Minister today, heavily trailed as an attempt to place housing at the heart of the policy agenda once again, it is well worth looking at the role that the UK’s housing market plays in the macroeconomy.
As I observed in my Commentary in the last issue of the National Institute Economic Review the housing market in the UK is not far off a national obsession. The number of households who are owner occupiers has grown dramatically (figure 1). There were just under 12 million in 1980 and this peaked at just over 18 million in 2008. And although the fraction of householders who were homeowners peaked at around 70 per cent in the early part of this century and declined to some 62 per cent by 2014, the increase in home ownership almost directly offset the fall in local authority housing provision over the same period. Since the early part of this century there has, though, been an increase in those renting privately and from housing associations.
Fig 1 – Trends in home ownership

The overall value of the housing stock is some £7 trillion and around 3.5 times national income. Households tend to treat housing as a composite of both wealth-holding asset and consumption good rather than just consumption and it has shown a remarkable performance in the UK as an asset class. It has often outperformed the all-share equity index. Accordingly, households hold a particularly large fraction of household wealth in real estate than in other classes of financial assets.
There is a genuine question of affordability with housing. The rapid increase in wages after WW2 rapidly increased the affordability of housing to a level at which it remained from the mid-1950s to the mid-1990s with the house price booms of the 1970s and the 1980s quickly petered out. But the subsequent doubling of house prices relative to weekly earnings has been a surprise. Essentially since 1997, house prices have become twice as expensive relative to incomes.
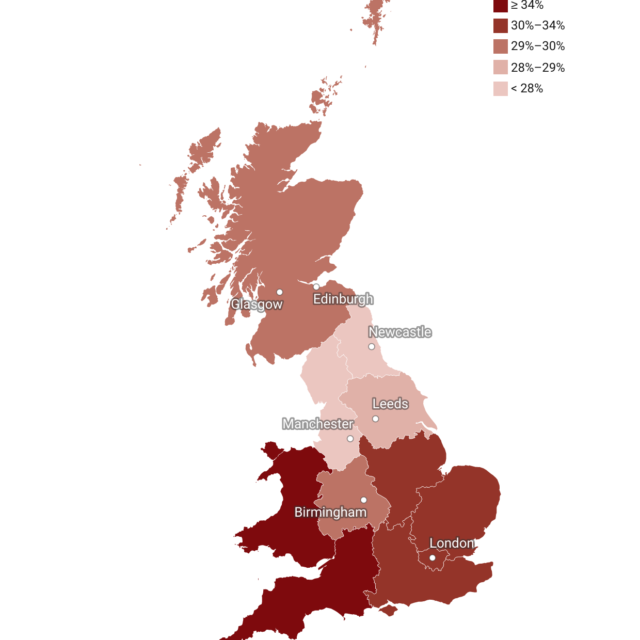
On the issue of rising house prices and affordability there is a there is considerable regional heterogeneity in house prices. The rate of exchange between a house in London and in the North East, implies, at least, 1 for 3. Similarly the ratio of house prices in the South versus those in the North is in the order of 1:2. These price differences are mirrored in the measures of regional productivity at the regional level and may imply that there are fundamental factors for the heterogeneity, with access to London explaining regional price patterns.
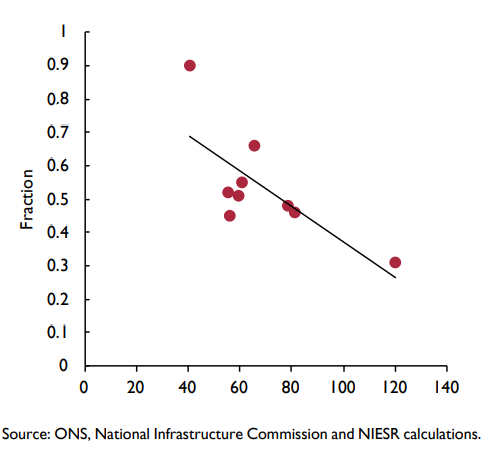
We can compare the increase in housing supply with the increase in the population. Using house building completions as the measure of supply this shows a ratio of 0.46 for England as a whole, over the period 1991 to 2014, with the range varying from 0.31 in London to 0.66 in the North West and 0.9 in the North East. In other words, housing supply has been particularly constrained in London and the South East where house price increases have been highest. It seems that increasing supply would do much to alleviate relative house prices.
Fig 2 – Regional English house price rises (2004–17) versus housing completions/population
As for the issue of social exclusion deriving from high property prices the question is whether those outside the transfers of property wealth from older generation to younger generation will be able to participate in the housing market.
Indeed it is possible that reducing the riskiness of lending may have increased the participation problem and possibly made borrowing by other means more problematic. For example, saving 15 per cent of a £350,000 house is no mean feat, particularly if the underlying house price increases by 5 per cent per year meaning that some £85,000 will be required as a deposit in ten years and that implies saving some £8000 per year if we allow savings to accrue interest.
If an aging population is holding too much financial wealth in its houses then some methods of allowing housing equity withdrawal will make a lot of sense. And given that much of the purchases of housing involve leveraged purchases, where equity might be as little as 5 per cent of the underlying asset value, then providing incentives for widening equity participation may both provide a way of allowing more agents to benefit from returns in the property sector and also reduce the riskiness of borrowing. But solutions to the housing problem ultimately depend on the social objective function. And if we wish everyone to have a home of their own then the clear answer will not be far away from increasing supply.
The National Institute is co-organising with RICS and CaCHE a special conference on these themes, under the title “The Broken Housing Market” for later in the spring. Please keep an eye on our events page for updates.
Related Blog Posts

Child Language Brokering: What It Is and How It Is Experienced By Migrant Families
29 Jan 2024
7 min read

What are the Experiences of Latin American Migrants Accessing Healthcare?
16 Oct 2023
5 min read


Related Projects


Related News

1.2 million UK Households Insolvent This Year as a Direct Result of Higher Mortgage Repayments
22 Jun 2023
2 min read

Thousands Of Households Projected To Face Monthly Mortgage Repayments Greater Than Their Monthly Incomes
03 Nov 2022
2 min read

Related Publications

The Nature of the Inflationary Surprise in Europe and the USA
21 Mar 2024
Discussion Papers

Supporting Immigration Advice Amidst Financial Challenges: Local Authorities’ Funding Initiatives
29 Feb 2024
Topical Briefing

Implications of the Transition from Defined Benefit to Defined Contribution Pensions in the UK
07 Feb 2024
UK Economic Outlook Box Analysis

Exploring Alternative Data Sources for Household Wealth Statistics
24 Jan 2024
Discussion Papers
Related events

Taxing Consumption