The Lockdown Weighted inflation CPILW for September 2020
This blog is written by NIESR Fellow Huw Dixon. Any opinions expressed in the paper are those of the author, and do not necessarily reflect the views of the Institute
Summary
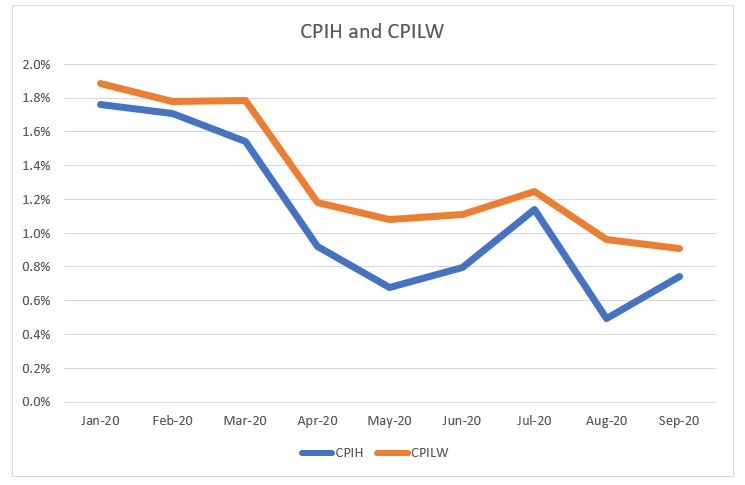
The CPIH measure of inflation has increased to 0.7% in September 2020, from its August level of 0.5%. The CPILW decreased slightly to 0.9% from the August value of 1.0%.

Authors
This blog is written by NIESR Fellow Huw Dixon. Any opinions expressed in the paper are those of the author, and do not necessarily reflect the views of the Institute
Summary
The CPIH measure of inflation has increased to 0.7% in September 2020, from its August level of 0.5%. The CPILW decreased slightly to 0.9% from the August value of 1.0%.
The gap between the official measure using pre-pandemic expenditure weights and the measure using Lockdown weights has decreased from 0.5% in August to just 0.2% in September. Since the gap in August was driven by the large “Eat out to Help Out” effect in CPIH, the ending of the scheme had less effect on CPILW.
Main Text
The CPILW for September 2020 is 0.9%, slightly down from 1.0% in August. This is 0.2% above the official CPIH of 0.7%, indicating that the official inflation measure of CPIH has continued to understate inflation. The gap between the two measures has fallen since the previous month, where it was temporarily increased due to the “Eat out to help out” scheme (CPILW has a lower weight for Restaurants than CPIH).
Since April 2020, the CPIH inflation figures have been constructed using the new methodology outlined ONS 2020 for dealing with the effects of the coronavirus. As discussed in one of Dixon’s previous NIESR Blogs, this fails to adequately take into account the changes in expenditure shares during the Lockdown. Dixon (NIESR policy paper 16, April 22nd 2020) proposed a trial statistic CPILW to measure inflation using guesstimates of the Lockdown expenditure weights. Since then the ONS has published its best estimates of expenditure weights in the second quarter of 2020 (ONS July 2020) and the guesstimates of CPILW were in the main consistent with these.
The ONS published estimates for expenditure shares in 2020 Q2 were based on a wide range of reliable data (see below). How do the ONS figures compare to my guesstimates from April? These are set out in the figure below by COICOP division. The CPIH weights are in blue: my guesstimates are in brown and the ONS figures for expenditure shares in Q2 are in grey.
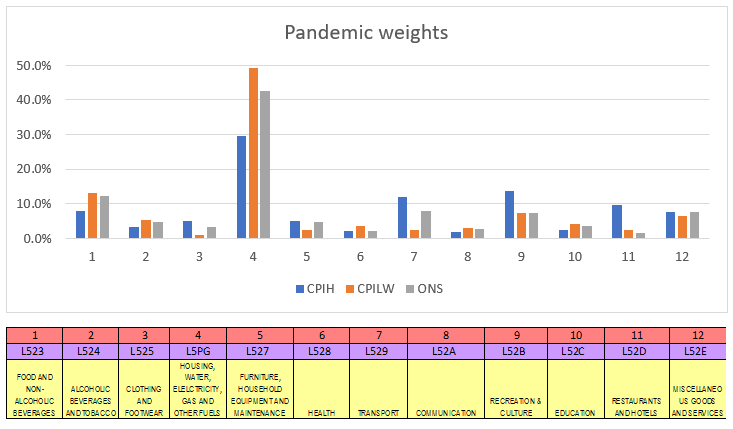
As can be seen, for some COICOP divisions my “guesses” were closer to the Q2 ONS weights than the CPIH weights are: these include divisions 1,2,4,8,10,11. In other divisions, the CPIH weight is closer to the Q2 weight (divisions 3, 5, 6 and 7). In April I was guesstimating the full lockdown, whilst Q2 reflects the later months when the lockdown was eased. How do these differences play out in the actual inflation figures?
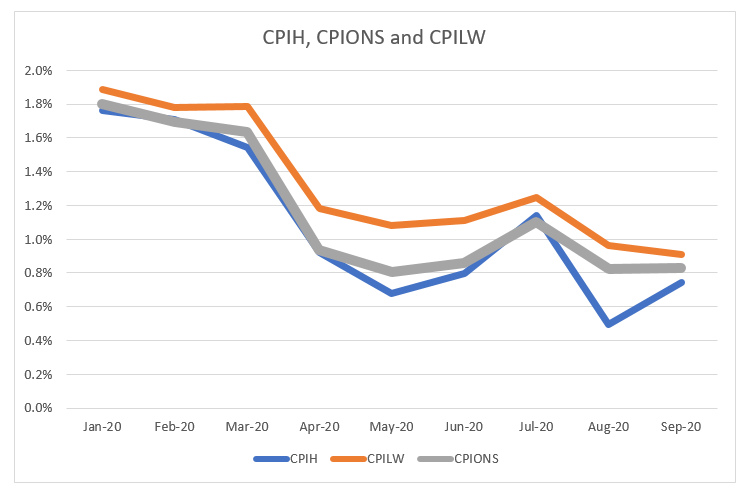
To answer this question, I used the ONS estimates of expenditure shares in Q2 and constructed the corresponding inflation time-series CPIONS. As we can see, for the period April to July, the CPIONS is closer to CPIH. The main reason for CPIONS to be closer to CPIH in the period April to July is the smaller weight in CPILW for Division 3 (Clothing and Footwear). The CPILW weight under-guesstimated the amount of online shopping in this division. CPILW also under-guesstimated the expenditure in Division 7 (Transport). However, if we look at August and September, the CPIONS is exactly in the middle between CPIH and CPILW at 0.8% for both months.
Changing expenditure shares can increase or decrease measured inflation, depending on how the different inflation rates for each type of expenditure behave. As time passes, we will see better measures to capture how expenditure is changing with the pandemic and this will help us to interpret the official inflation figures.
Further Reading:
ONS Corona Virus and the effect on UK Prices. May 5th 2020. https://www.ons.gov.uk/economy/inflationandpriceindices/articles/coronavirusandtheeffectsonukprices/2020-05-06)
Huw Dixon, How can we measure consumer price inflation in a lockdown? Economics Observatory (May 25th 2020).
ONS Re-weighted consumer prices basket – adjusting for consumption changes during lockdown: July 2020. (August 19th 2020)
Related Blog Posts


Related Projects


Related News
Letter to the Financial Times: Is Perfidious Albion About to Make a Return?
14 Jun 2024
3 min read

Call for Papers: Lessons From Quantitative Easing & Quantitative Tightening
09 Feb 2024
1 min read
Related Publications

Everything You Wanted to Know About the US Budget Deficit and Debt But Were Afraid to Ask
09 May 2024
Global Economic Outlook Box Analysis
To What Extent Has the Recovery and Resilience Facility Supported the EU Recovery from Covid?
09 May 2024
Global Economic Outlook Topical Feature
Inflation Differentials Among European Monetary Union Countries: An Empirical Evaluation With Structural Breaks
20 Nov 2023
National Institute Economic Review
Related events
2024 UK General Election: The Economy and Living Standards
Assessing Cycles and Structural Changes in Markets
Business Conditions Forum