Inflation will Remain Above 3 per cent Throughout 2025 and into 2026
Authors
Annual CPI inflation fell slightly in May to 3.4 per cent from 3.5 per cent in April (though the ONS made a mistake with the April figure, which should have only been 3.4 per cent). The new inflation in the month from April to May 2025 was 0.2 per cent which combined with the inflation dropping out from the same months the year previously (0.3 per cent) led to the fall in the headline inflation rate of 0.1 percentage points. This small change should have little effect on the trajectory of inflation over the coming months, with inflation set to remain high for 2025, even if there is no escalation in the Israel-Iran war. If the Israel-Iran war escalates and others get involved, then there could be a significant increase in inflation as world oil and liquefied natural gas (LNG) supplies get disrupted.
Services inflation has fallen steeply to 4.7 per cent from 5.4 per cent. Goods price inflation has increased from 1.7 per cent to 2.0 per cent. Core inflation (CPI excluding food and energy) has also fallen to 3.5 per cent from 3.8 per cent. The latest ONS data on wages (February to April 2025) shows year-on-year increases fell slightly to 5.3 per cent. The NIESR trimmed mean inflation measure (an alternative measure of core inflation) has remained at 1.8 per cent. Taken together, these figures indicate that inflationary pressures are still with us and likely to persist into the coming months. The high wage inflation suggests that we may be entering a wage-price spiral.
This biggest contributors to the changes in headline inflation between April and May were:
Transport -0.35 percentage points
Food and non-alcoholic beverages 0.11 percentage points
Furniture and household goods 0.07 percentage point.
We can look in more detail at the contributions of the different sectors to overall inflation in figure 1 below, with the old inflation dropping-out of the annual figure (April-May 2024) shown in blue and the new monthly inflation dropping in (April-May 2025) shown in brown. The overall effect is the sum of the two and is shown as the burgundy line. Overall, if we focus on the brown new inflation, there were nine positive contributions with only two negatives. The fact that there was positive “new” inflation across most sectors indicates that inflationary pressures have not gone away and are widespread throughout the economy. The blue dropouts were positive in one sector and negative in 10. The brown and the blue reinforced each other for Transport, giving a large dampening effect on headline inflation: without the effect of Transport, we would have seen no decline in the headline inflation figure.


Looking forward through 2025 into 2026
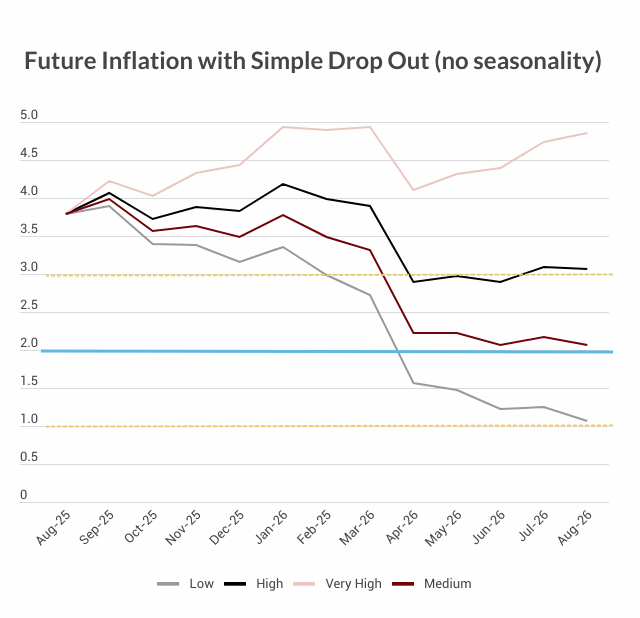
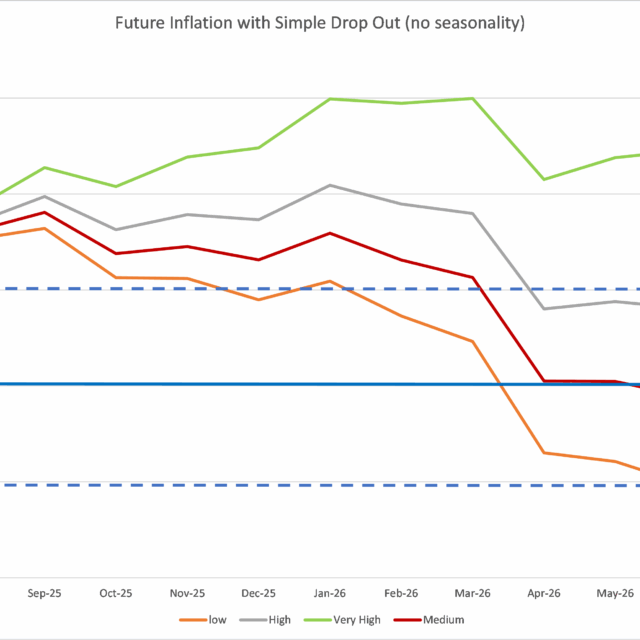
We can look ahead over the next 12 months to see how inflation might evolve as the recent inflation “drops out” as we move forward month by month. Each month, the new inflation enters the annual figure and the old inflation from the same month in the previous year “drops out”. Previously we ended the “low inflation” scenario but have reintroduced it in response to some recent months with near zero month-on-month inflation. We depict the following scenarios for future inflation dropping in:
- The “low” scenario assumes inflation each month is equivalent to 1 per cent per annum (0.08 per cent per calendar month).
- The “medium” scenario assumes that the new inflation each month is equivalent to what would give us 2 per cent per annum or 0.17 per cent per calendar month – which is both the Bank of England’s target and the long-run average for the last 25 years.
- The “high” scenario assumes that the new inflation each month is equivalent to 3 per cent per annum (0.25 per cent per calendar month).
- The “very high” scenario assumes that the new inflation each month is equivalent to 5 per cent per annum (0.4 per cent per calendar month). This reflects the inflationary experience of the United Kingdom in 1988-1992 (when mean monthly inflation was 0.45 per cent).
Previously we have followed the “very high” or “high” scenarios. We think that now inflation is more likely to come in the “high to Medium” range. This would indicate that inflation in June may remain unchanged at 3.4 per cent (medium and high) or increase slightly to 3.6 per cent (very high). Under all three scenarios (medium, high and very high), inflation remains above 3 per cent for the next 12 months. Even with the (highly unlikely) low scenario, inflation remains above 2 per cent over the same period.
This forecast assumes that geopolitical tensions do not deteriorate. I have commented on these in previous blogs and events in Ukraine and the middle east remain highly uncertain. The attack by Israel on Iran marks the beginning of a conflict that could spread as allies on both sides get drawn in. Currently, the Iranian retaliation is restricted to targets in Israel and so the conflict is relatively contained. However, if Iran is attacked by the US and others, the Straits of Hormuz are likely to be closed by Iran resulting in a massive supply shock for the world supply of oil and LNG. If Iranian allies such as Russia and China become involved, then the repercussions could be much greater. The Israeli-Iran war could certainly result in a big supply side shock to inflation in the coming months.

Related Blog Posts

Related Projects


Related News


Related Publications
Related events

NiGEM Workshop: Introduction of Fiscal Packages into NiGEM (International Examples)
NiGEM Workshop: Modelling Fiscal Rules in NiGEM
NiGEM Workshop: Forecasting in NiGEM
NiGEM Workshop: Unwinding Conflict Scenarios in NiGEM
NiGEM Workshop: General Imbalances and Structural Trends: An Exercise Using NiGEM

Summer 2023 Economic Forum
Spring 2023 Economic Forum